An iOS network inspector lets developers examine requests, headers, timing, and responses generated by an app, depending on the tool. A failed API call used to mean adding print statements, rebuilding the app, and waiting for the bug to reappear. An inspector replaces that cycle.
What Is an iOS Network Inspector?
An iOS network inspector is a tool that lets developers view HTTP, HTTPS, or WebSocket traffic sent by an iOS or macOS app, without external hardware or a man-in-the-middle proxy. Depending on the tool, it may support all three protocols or just HTTP and HTTPS.
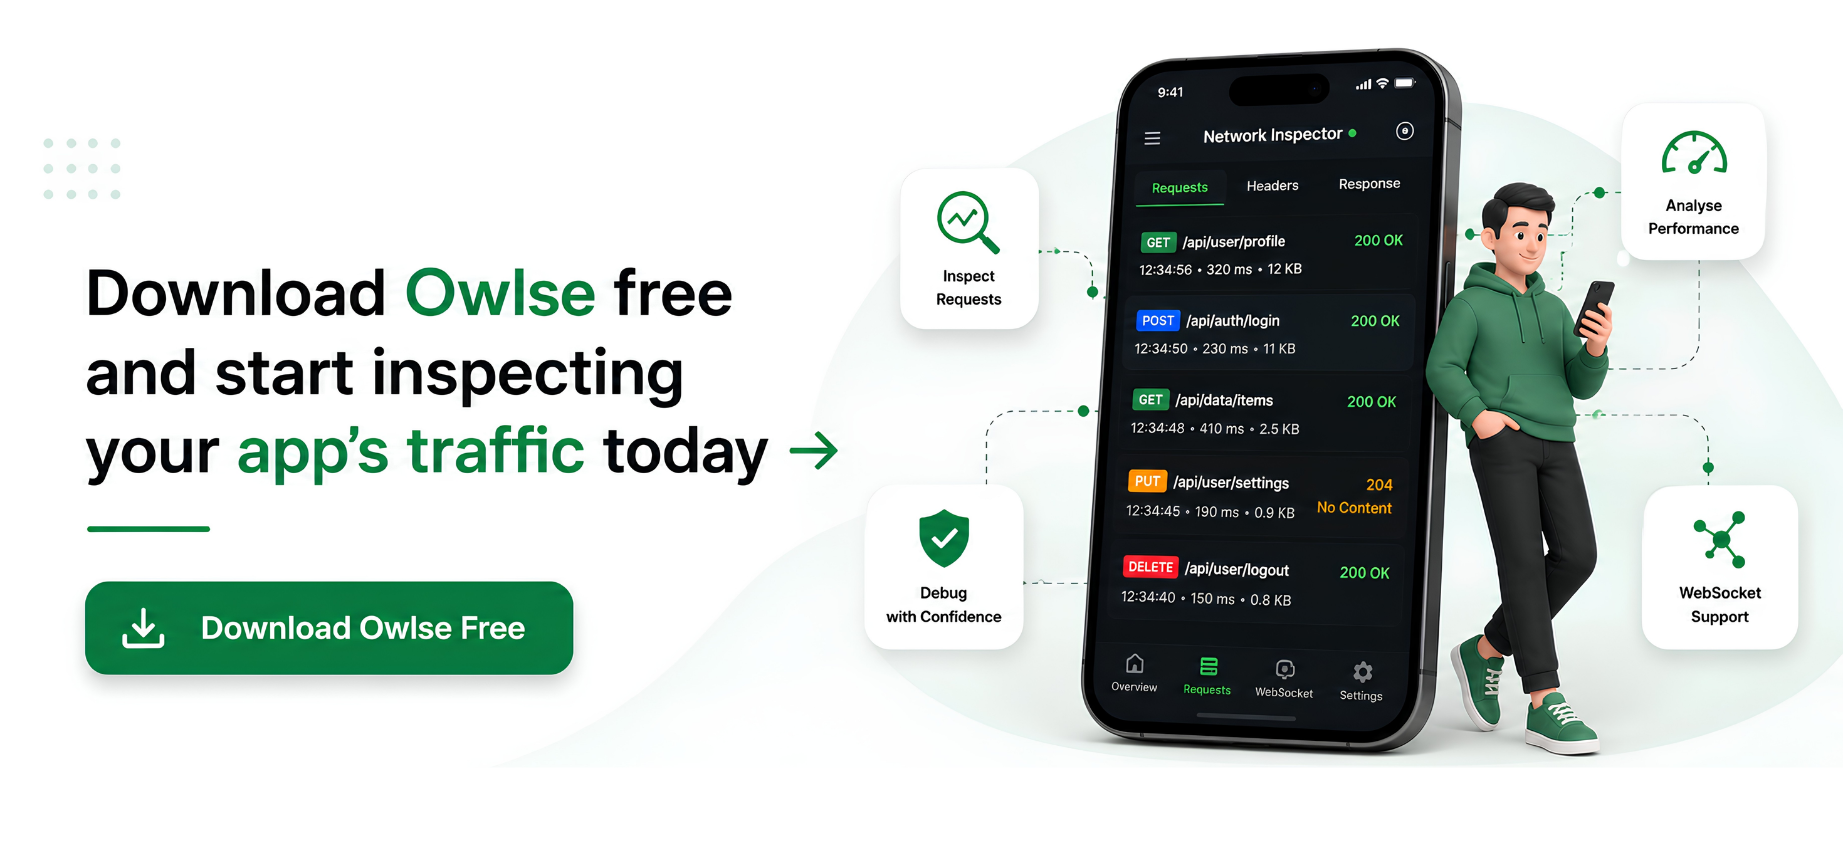
Some tools work as system-wide proxies, intercepting traffic between your device and the internet. Others, like Owlse, use an SDK embedded in your app that streams traffic to a companion Mac app over your local network.
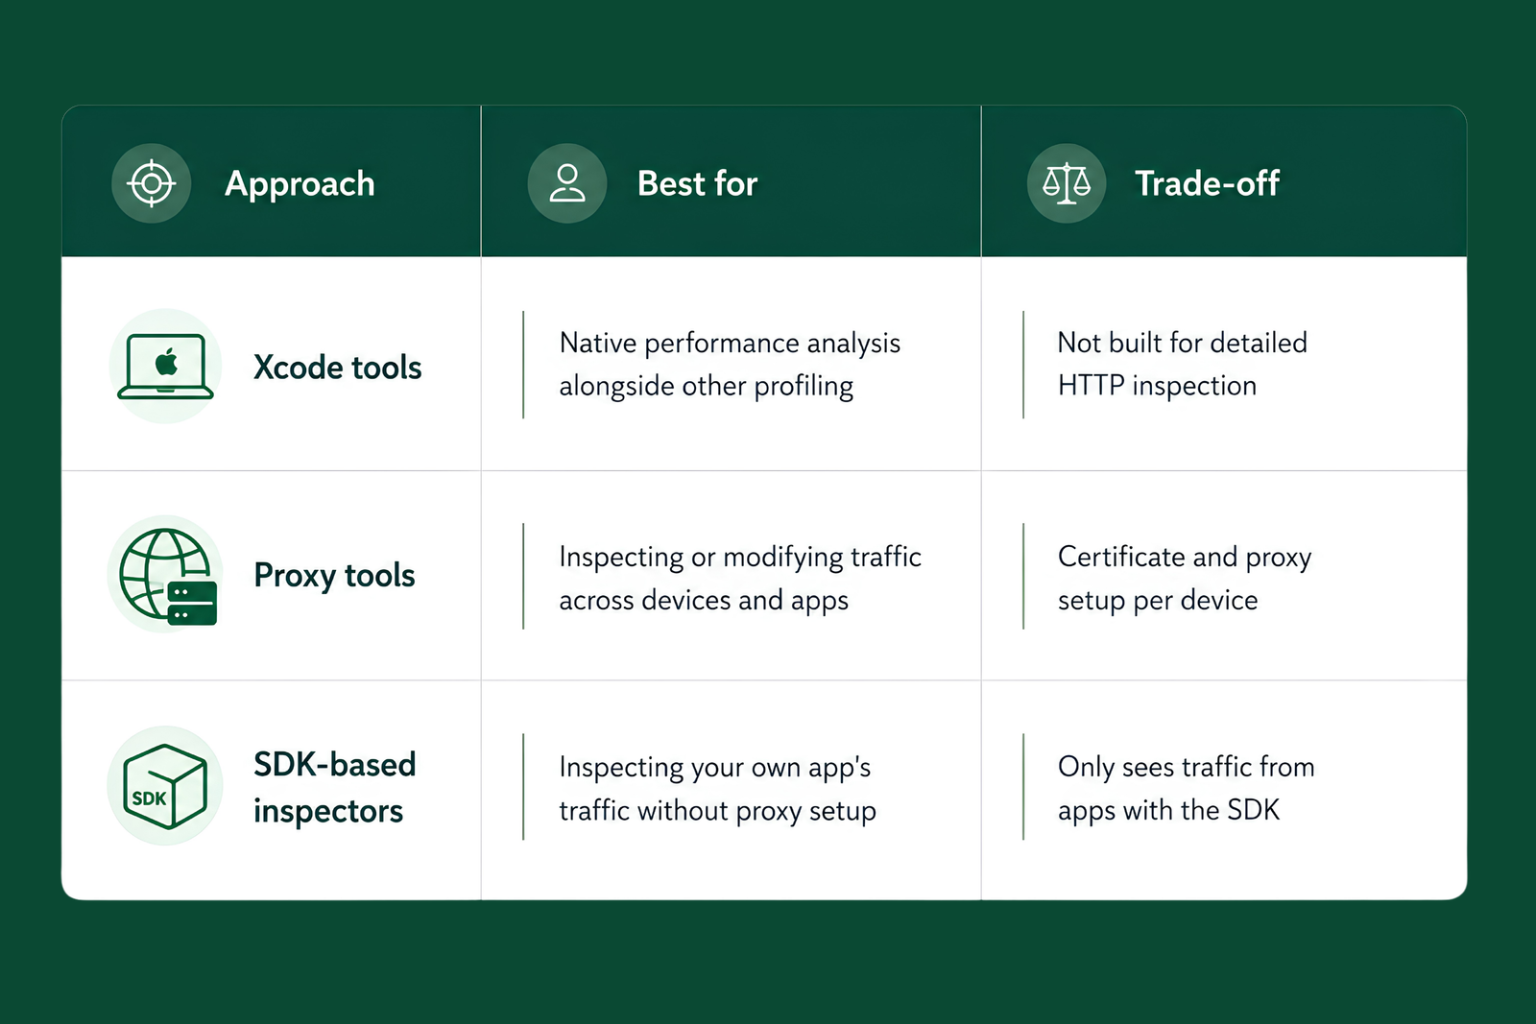
Proxy tools need a certificate installed on every test device, which can fail on managed corporate hardware. SDK-based iOS debugging tools skip that step, since they only see traffic from the app that includes the package.
Why Does iOS Network Monitoring Matter?
Network reliability shapes whether users stay or uninstall, since most iOS apps are thin clients talking to a backend for login, payments, feeds, and notifications.
Yodel Mobile's analysis of app crash data puts network issues at roughly 20% of all app crashes, since apps that depend on cloud services stay exposed to connectivity failures the code often isn't built to handle.
Business of Apps' 2026 performance data shows iOS apps averaging a 99.93% crash-free session rate industry-wide. iOS network monitoring during development is how teams close that gap before release, not after a support ticket lands.
What Are the Most Common iOS Debugging Challenges?
Four problems recur most often across codebases doing iOS debugging against a live backend:
Silent failures: a request fails, but error handling swallows it instead of surfacing what went wrong
Timing issues: a screen renders before a dependent API call finishes, showing stale or missing data
Header mismatches: an auth token expired, or a header got dropped in a retry chain
Environment drift: staging and production respond differently, and nobody catches it until launch
Print statements catch obvious failures well. Headers and timing issues are harder to spot that way, which is where inspecting live traffic through HTTP debugging tools earns its place in a normal workflow.
How Do iOS Network Inspectors Work?
Depending on the tool, inspectors capture requests either through a system proxy that reroutes traffic, or through an SDK that logs calls as they fire inside the app itself.
Proxy tools decrypt HTTPS traffic using a locally trusted certificate, which needs installing on every test device. SDK-based tools skip that layer. A package inside the app captures each request as it happens and streams it to a Mac app overBonjour, Apple's local network device discovery protocol.
This gives developers a focused view of traffic generated by their own app, which is the core idea behind iOS app debugging with an SDK-based tool.
Our iOS team at LoudOwls builds native apps with Swift and SwiftUI and handles App Store submission end-to-end.
Real iOS App Debugging Scenarios
Scenario 1: Login works on Wi-Fi but fails on cellular. Check the request URL and HTTP status first, then the Authorisation header specifically, since expired or malformed tokens are a common cause. Look at DNS and connect timing next. If those are slow only on cellular, timeout handling is the likely culprit, not the login logic.
Scenario 2: The API call succeeds, but the screen still feels slow. Isolate the bottleneck by comparing DNS, connect, and waiting time against download time. A slow waiting phase usually points to backend processing. A slow download phase with a large response points to payload size instead.
Scenario 3: A WebSocket connection keeps dropping. Check frame timing and connection duration before assuming the backend is at fault. A pattern of drops at a consistent interval often points to a client-side keep-alive issue rather than the server. Spotting that pattern is exactly the kind of iOS app debugging a proper inspector makes fast.
Which iOS Debugging Tool Should You Use?
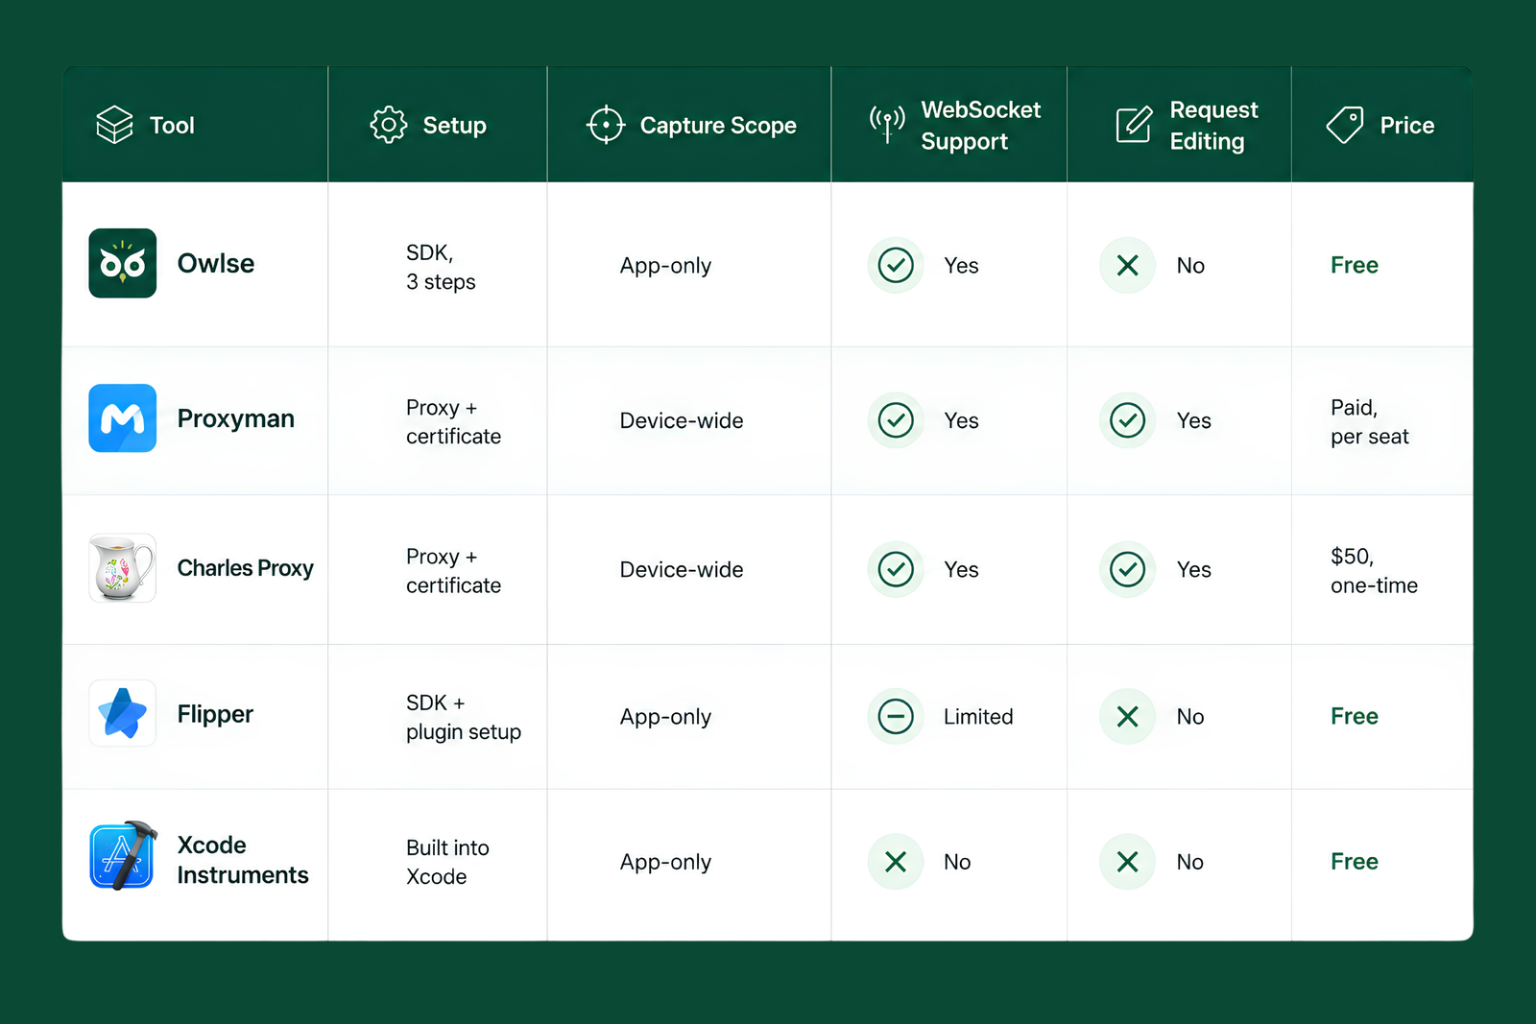
The right iOS debugging tools depend on whether you need proxy-based traffic editing or lightweight SDK-based inspection:
Proxy tools see traffic from every app on the device, which helps when you're inspecting something you didn't build yourself. SDK-based network debugging tools only see traffic from apps that include the package, a narrower but more predictable scope for your own code.
Where Does Network Debugging Fit in the iOS Development Process?
Architecture and API contracts: define request and response shapes before writing networking code
Feature development: build against a staging API with an inspector running from day one
QA and internal testing: run across multiple devices and network conditions, alongside standard iOS testing tools, before App Store submission
Pre-release hardening: simulate poor connectivity and confirm the app degrades gracefully
Post-launch monitoring: pair crash reporting with network activity data to catch what only surfaces at scale
Skipping step 2 tends to push discovery into QA instead. By then the developer who wrote the code has usually moved on, so tracing the bug back takes longer than it would have earlier.
How Does an SDK-Based Inspector Compare to Proxy Tools?
An SDK-based inspector like Owlse only sees traffic from your own app, while a proxy tool like Charles or Proxyman sees traffic from every app on the device.
Owlse streams that traffic directly from your app to your Mac over your local network, avoiding proxy and certificate setup entirely. It runs as a native macOS network monitor with a persistent store per device and crash reporting enabled by default, per the current Owlse product page. A timeline waterfall view helps spot slow screens rather than just slow individual requests. When comparing iOS developer tools, the main trade-off is broader capture versus simpler setup.
The trade-off is simple: setup is easier, but you only see traffic from your own app, and only on Apple's platforms. Teams also shipping Android will need a separate tool for that codebase.
How Much Do iOS Debugging Tools Cost?
Costs for iOS debugging tools range from free to roughly $50-70 for a one-time license, depending on whether you need proxy-based traffic editing or just request inspection.
Owlse and Xcode Instruments cover most day-to-day HTTP debugging needs at no cost.Charles Proxy costs $50 for a single-seat license, a one-time fee rather than a subscription.Proxyman is priced per seat, with team licensing for larger engineering teams.
Price isn't the only factor to consider. The real question is whether a proxy's traffic-editing features are worth the certificate overhead, or whether a free macOS network monitor already handles the team's daily needs.
Best Practices for iOS Network Debugging
Run an inspector during every feature branch, not just before release, so iOS testing tools aren't the only line of defence
Test on real devices across Wi-Fi and cellular, since simulator networking doesn't behave the same way
Log request timing alongside success and failure, since slow requests often precede outright failures
Compare staging and production responses on a schedule, using network debugging tools that support side-by-side diffs
On managed or enterprise devices, confirm whether your organisation allows certificate installation before choosing a proxy-based tool over an SDK-based one
Treat captured traffic with care. Auth tokens and personal data can appear in logs, so exported captures deserve the same handling as production credentials
Device fragmentation is worth testing for too. A handful of iPhone models and iOS versions can surface issues a single test device won't, especially around how iOS handles background network activity.
How Do You Simulate Poor Network Conditions on iOS?
Apple's ownNetwork Link Conditioner is one way to test how an app behaves under poor network conditions, without needing a proxy or a physical trip to a low-signal area.
It ships inside Xcode's "Additional Tools for Xcode" package, available from theApple Developer downloads page. Once installed, it adds preset network profiles, including Edge, 3G, LTE, high-latency DNS, and 100% packet loss, plus the option to build a custom profile.
There are two ways to use it:
On the Simulator or a connected device: open Xcode, go to Window → Devices and Simulators, select the device, and choose a profile under Device Conditions
Directly on a physical iPhone: once the device is enabled for development, a Developer section appears in Settings, with Network Link Conditioner available there directly
This matters for the same reason network debugging tools matter in general: a request that looks fine on office Wi-Fi can fail on a throttled or lossy connection. Testing a login flow or a large image upload under a simulated 3G or high-packet-loss profile catches timeout and retry bugs that a fast connection will never surface.
One thing to remember: turn it off after testing. Left on, it throttles the entire Mac's network connection, not just the app under test.
How Do You Read HTTP Status Codes When Debugging?
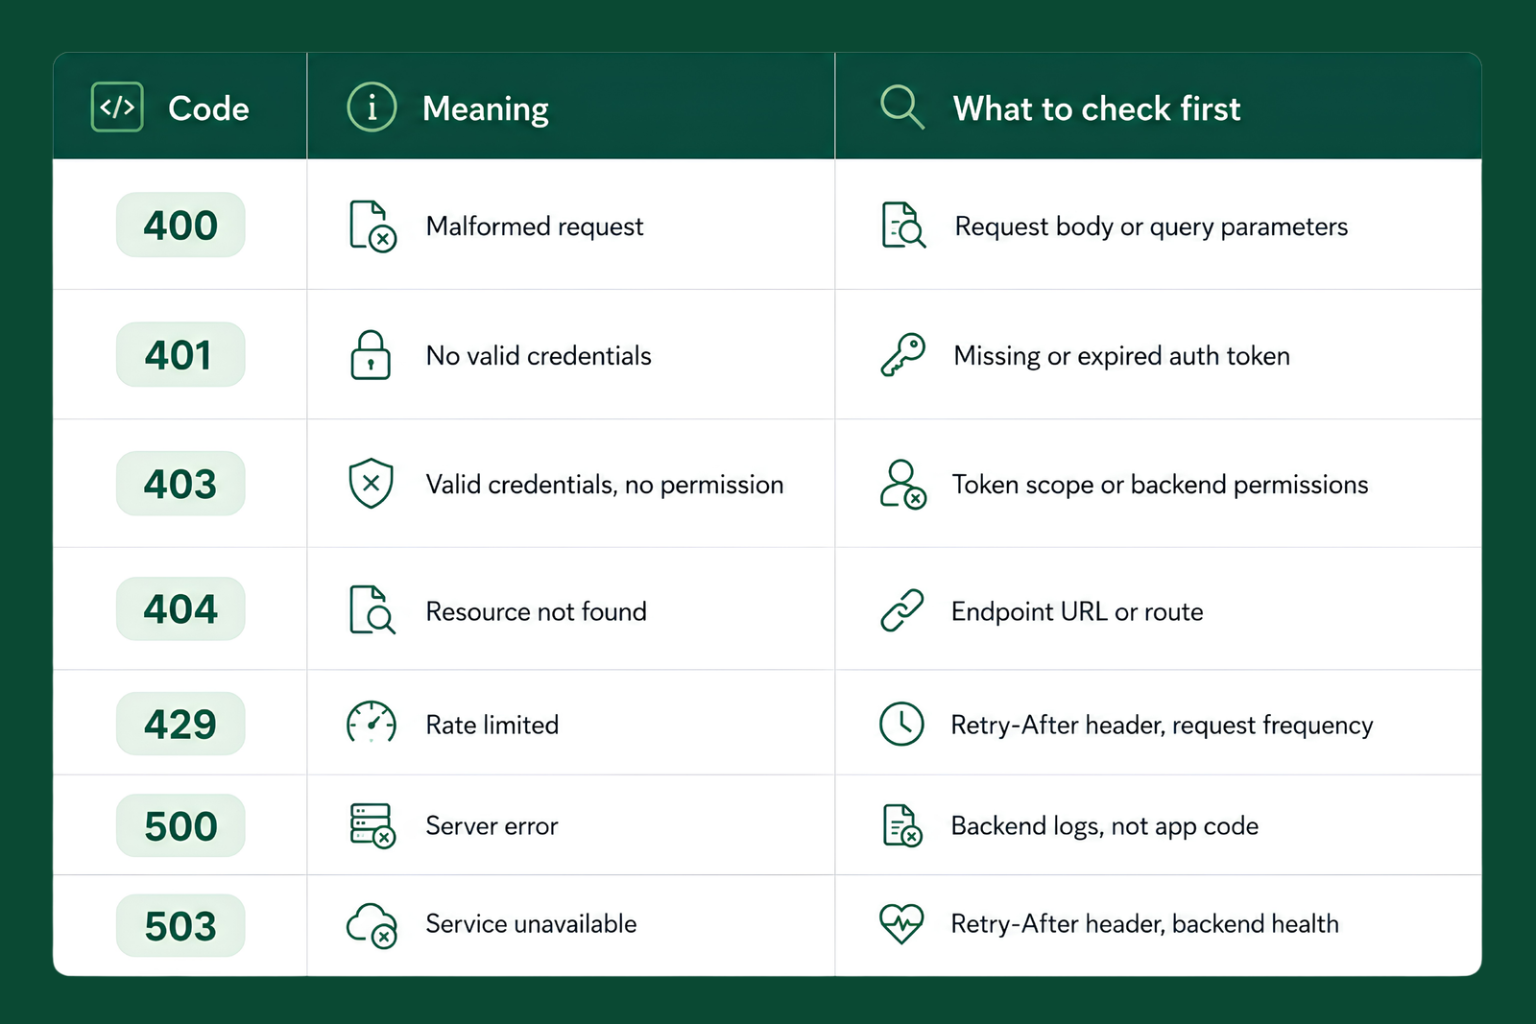
Status codes tell you where to start looking. A 401 means there's no valid login info at all. A 403 means the login info is fine, but it doesn't have permission, usually a backend or scope issue, not a bad token.
5xx codes point to the server, not your code. Try the same request outside the app, with something like Postman, before you go hunting for a bug that isn't there. And if you see a Retry-After header on a 429 or 503, actually wait that long. Ignoring it just means hammering a server that's already struggling.
Why Teams Choose LoudOwls for iOS Network Debugging
Most teams don't have someone dedicated to catching network bugs early; it usually falls to whoever's building the feature that week. LoudOwls iOS team treats it as its own step: request testing, timing checks, and error handling get built in from day one, not added after a bug report shows up.
If your app has flaky API calls, crashes that only hit some users, or a backend that behaves differently across staging and production, this is the kind of work that the team does regularly.
Frequently Asked Questions
What should I look for when choosing an iOS network inspector?
Match the tool to your capture scope. If you only need to debug your own app, an SDK-based tool avoids certificate setup entirely. If you need to inspect traffic across multiple apps or devices, a proxy tool fits better despite the extra setup.
Can I inspect API requests from a physical iPhone, not just the simulator?
Yes. Both proxy-based and SDK-based tools work on physical devices. SDK-based tools typically connect over your local network via Bonjour, while proxy tools require configuring the device's network settings to route through the proxy.
How do I debug a slow API request in an iOS app?
Break the request down by phase: DNS lookup, connection, waiting time, and download time. A tool that shows this breakdown lets you isolate whether the delay is server-side or related to payload size.
Can an iOS network inspector modify requests and responses?
It depends on the tool. Proxy-based tools like Charles Proxy and Proxyman support request rewriting and mocking. Most SDK-based tools, including Owlse, focus on read-only inspection rather than editing live traffic.
Are free iOS debugging tools good enough for production apps?
Free tools can be sufficient for many production debugging workflows, depending on the features you need. Owlse and Xcode Instruments, for example, cover request inspection and timing breakdowns at no cost, though feature depth varies by tool.
How do I inspect network requests without installing anything?
Xcode already has this built in. Open Instruments and use the Network template; no download needed. It won't show you full request or response bodies like a dedicated inspector would, just high-level timing, but it's enough for a quick check when you don't want to add another tool to the project.
Final Thoughts: Choosing the Right iOS Network Inspector for Your Team
Network bugs are expensive to trace with print statements and fast to fix once you can see the actual traffic. Whether it's a login that fails only on cellular or a WebSocket that drops without explanation, a network inspector gives developers the details they need to narrow down the problem.
If your team is building or scaling an iOS app and network reliability keeps coming up, LoudOwls builds and audits apps with this kind of debugging discipline built in from the start.
With a decade of experience in global talent acquisition and HR leadership, Niti Aggarwal has helped build high-performing technology teams across India, Singapore, and LATAM. At LoudOwls, she focuses on people strategy, culture